minian.visualization module
-
class
minian.visualization.AlignViewer(minian_ds, cents, mappings, shiftds, brt_offset=0)[source]¶ Bases:
objectInteractive visualization of cross-registration resuls.
Hint

This class visualize the result of cross-registration by color-mapping spatial footprints of cells from three selected sessions as red, green and blue channel and show an overlay image. In addition to the overlay image, following tools are available:
- Channel Selector
Contains “sessionR”, “sessionG”, and “sessionB” dropdowns, allowing the user to select which sessions are colormapped to each channel.
- Display Settings
Contains the following tools:
“erode” dropdown, set window size of an optional erode operation applied to the spatial footprints for display to reduce overlaps.
“show matched” and “show unmatched” checkboxes, set whether to show cells that are matched or not matched across all three selected sessions.
- Metadata Selector
If additional metadata are present, dropdowns corresponding to each metadata dimensions will be shown.
- Parameters
minian_ds (xr.Dataset) – Input dataset. Should contain minian_ds[“A”].
cents (pd.DataFrame) – Input centroids of cells.
mappings (pd.DataFrame) – Input mappings of cells.
shiftds (xr.Dataset) – Input dataset of shift results. Should contain shiftds[“shifts”].
brt_offset (int, optional) – Brightness offset added on top of the color-mapped image. Useful to make the image visually brighter. By default 0.
-
class
minian.visualization.CNMFViewer(minian=None, A=None, C=None, S=None, org=None, sortNN=True)[source]¶ Bases:
objectInteractive visualization for CNMF results.
Hint
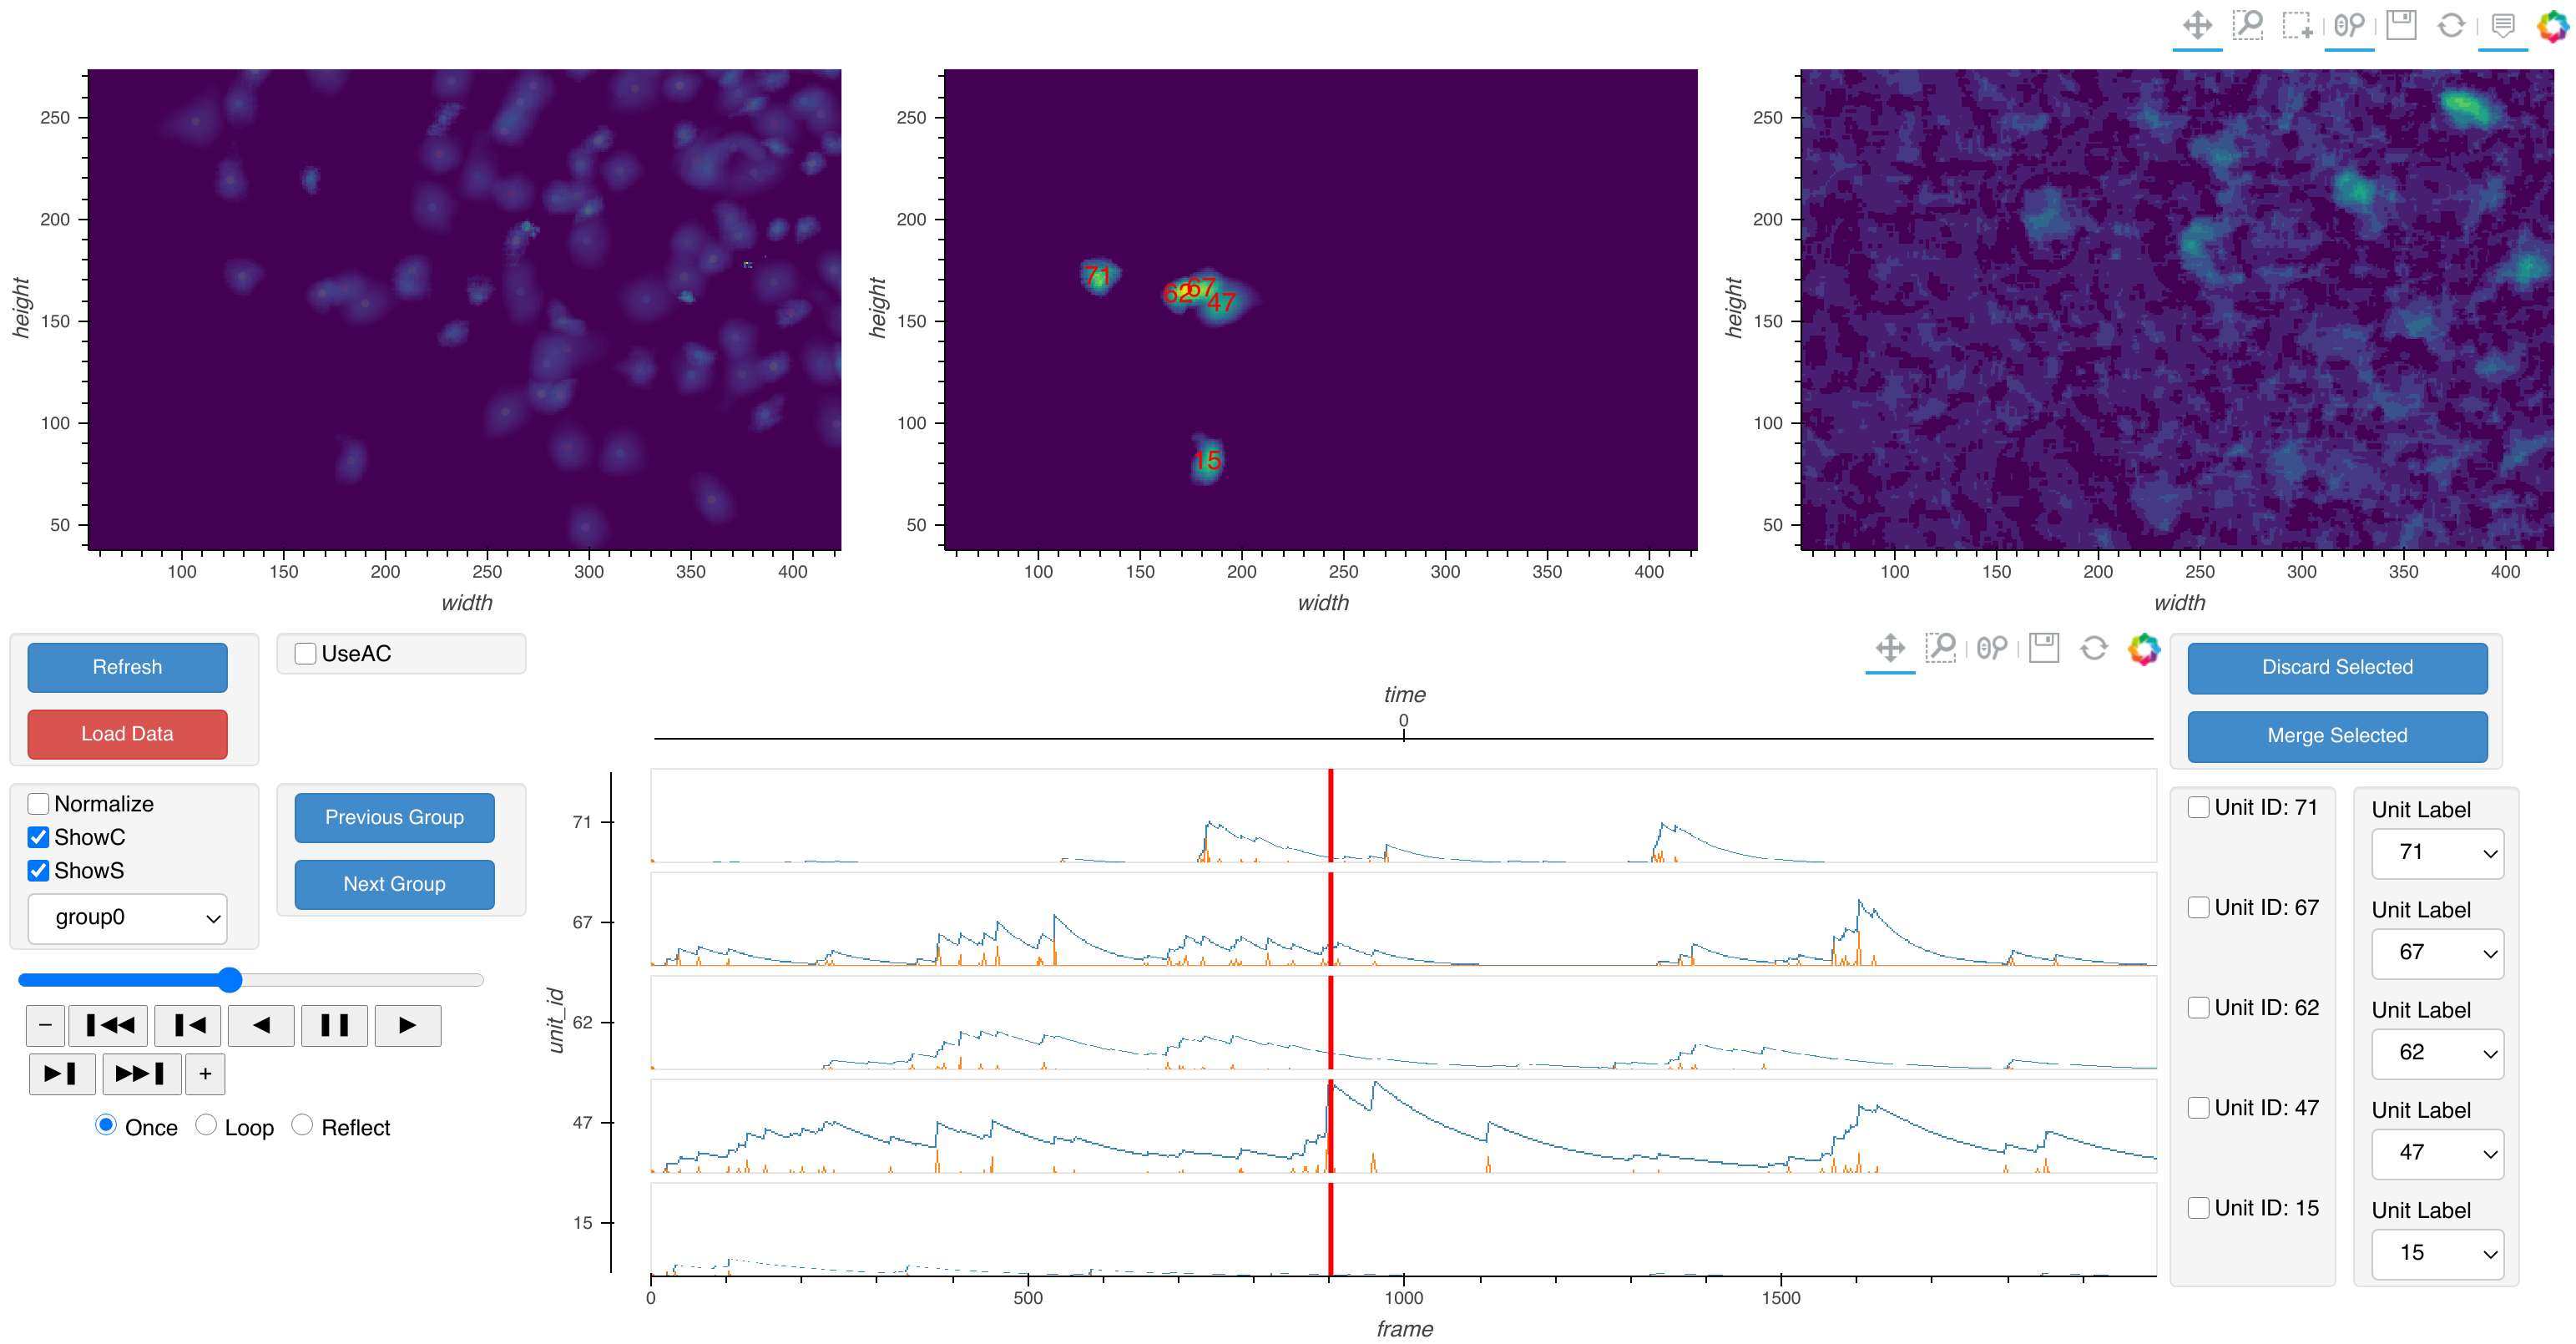
The visualization can be divided into two parts vertically:
- Spatial
Top part of the visualization. Shows spatial plots at a given time. From left to right:
- Spatial Footprints
Shows the spatial footprints of all cells. The “Box Select” tool can be used in this panel to select a subset of cells to visualize for both the Isolated Activities panel and the Temporal Activities panel.
- Isolated Activities
Shows activities of selected cells only. If the “UseAC” checkbox under General Toolbox is enabled, then the AtC variable computed with the selected cells will be visualized at the given frame (See
minian.cnmf.compute_AtC()). Otherwise the spatial footprints of the cells will be plotted, which would be invariant across time. The “unit_id” coordinates for each cell are shown on top of each cell.- Original Movie
Shows a single frame of an arbitrary movie data supplied in org.
- Temporal
Bottom part of the visualization. Shows temporal activities across time and various toolboxes. From left to right:
- General Toolbox
Contains the following tools:
“Refresh” button, will refresh all visualization when clicked.
“Load Data” button, will load all data in memory for faster visualization, can be very memory-demanding.
“UseAC” checkbox, whether to plot spatial-temporal activities for the Isolated Activities panel.
“ShowC”, “ShowS”, “Normalize” checkboxes, whether to show the calcium traces, the spike signals, or to normalize both traces to unit range for each cell.
“Group” dropbox, “Previous Group” and “Next Group” buttons, select the group of cells to visualize. The grouping is controled by sortNN parameter.
Playback toolbar, used to control which timepoint is visualized.
Additional metadata dropdown, if the input dataset contains additional metadata dimensions then dropdown will show up so user can select which dataset to visualize.
- Temporal Activities
Shows temporal activities of selected subset of cells. The red vertical line indicate current frame. Additionally user can double-click anywhere in the plot to move current frame to that location.
- Manual Label
Shows tools to carry out manual labeling of cells. User can either manually assign unit label using the dropdown for each cell, or select some cells with the checkboxes corresponding to the “unit_id”, and then merge or discard the units using the buttons. The “Unit Label” dropdowns should update and refelect the merging or discarding actions.
- Variables
unit_labels (xr.DataArray) – 1d array whose values represent the result of manual refinement of cells. The “unit_id” coordinate of this array is identical to input data. The values of this array can be interpreted as new “unit_id” after the manual refinement, where duplicated values indicate merged cells, and values of -1 indicate discarded cells.
- Parameters
minian (xr.Dataset, optional) – Input minian dataset containing all necessary variables. If None then all other arguments should be supplied. By default None.
A (xr.DataArray, optional) – Spatial footprints of cells. If None then it will be retrieved as minian[“A”]. By default None.
C (xr.DataArray, optional) – Calcium dynamic of cells. If None then it will be retrieved as minian[“C”]. By default None.
S (xr.DataArray, optional) – Deconvolved spikes of cells. If None then it will be retrieved as minian[“S”]. By default None.
org (xr.DataArray, optional) – Arbitrary movie data to be visualized along with results of CNMF. If None then it will be retrieved as minian[“org”]. If this array contains dimensions other than “height”, “width” or “frame” then they will be used as metadata dimensions. By default None.
sortNN (bool, optional) – Whether to sort the units using
NNsort()so that cells close together will appear in same group for visualization. If False then cells are simply grouped in 5 by ascending “unit_id”. By default True.
-
class
minian.visualization.VArrayViewer(varr, framerate=30, summary=['mean'], meta_dims=None, datashading=True, layout=False)[source]¶ Bases:
objectInteractive visualization for movie data arrays.
Hint
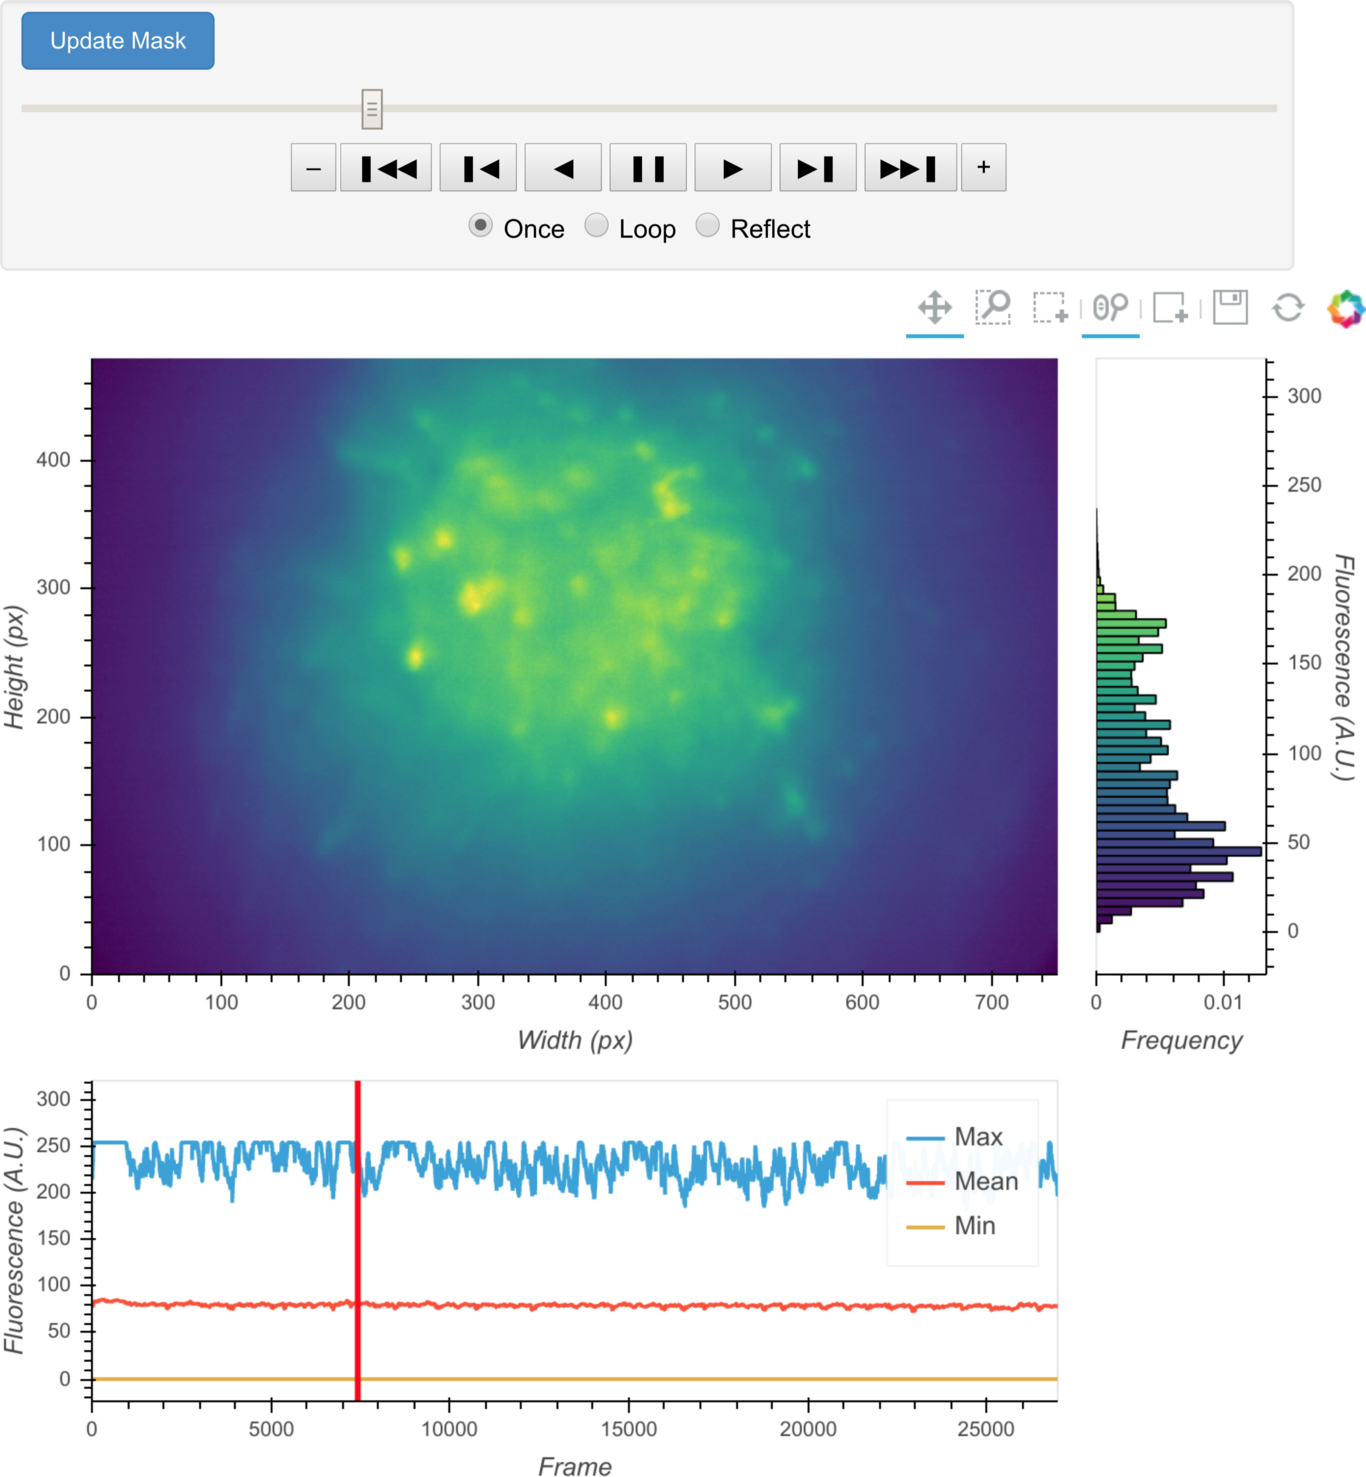
The visualization contains following panels from top to bottom:
- Play Toolbar
A toolbar that controls playback of the video. Additionally, when the button “Update Mask” is clicked, the coordinates of the box drawn in Current Frame panel will be used to update the mask attribute of the VArrayViewer instance, which can be later used to subset the data. If multiple arrays are visualized and layout is False, then drop-down lists corresponding to each metadata dimensions will show up so the user can select which array to visualize.
- Current Frame
Images of the current frame. If multiple movie array are passed in, multiple frames will be labeled and shown. To the side of each frame there is a histogram of intensity values. The “Box Select” tool can be used on the histogram to limit the range of intensity used for color-mapping. Additionally, the “Box Edit Tool” is available for use on the frame image, where you can hold “Shift” and draw a box, whose coordinates can be used to update the mask attribute of the VarrayViewer instance (remember to click “Update Mask” after drawing).
- Summary
Summary statistics of each frame across time. Only shown if summary is not empty. The red vertical line indicate current frame.
- Variables
mask (dict) – Instance attribute that can be retrieved and used to subset data later. Keys are tuple with values corresponding to each meta_dims and uniquely identify each input array. If meta_dims is empty then keys will be empty tuple as well. Values are dict mapping dimension names (of the arrays) to subsetting slices. The slices are in the plotting coorandinates and can be directly passed to xr.DataArray.sel method to subset data.
- Parameters
varr (Union[xr.DataArray, List[xr.DataArray], xr.Dataset]) – Input array, list of arrays, or dataset to be visualized. Each array should contain dimensions “height”, “width” and “frame”. If a dataset, then the dimensions specified in meta_dims will be used as metadata dimensions that can uniquely identify each array. If a list, then a dimension “data_var” will be constructed and used as metadata dimension, and the .name attribute of each array will be used to identify each array.
framerate (int, optional) – The framerate of playback when using the toolbar. By default 30.
summary (list, optional) – List of summary statistics to plot. The statistics should be one of {“mean”, “max”, “min”, “diff”}. By default [“mean”].
meta_dims (List[str], optional) – List of dimension names that can uniquely identify each input array in varr. Only used if varr is a xr.Dataset. By default None.
datashading (bool, optional) – Whether to use datashading on the summary statistics. By default True.
layout (bool, optional) – Whether to visualize all arrays together as layout. If False then only one array will be visualized and user can switch array using drop-down lists below the Play Toolbar. By default False.
- Raises
NotImplementedError – if varr is not a xr.DataArray, a xr.Dataset or a list of xr.DataArray
-
minian.visualization.NNsort(cents)[source]¶ Sort centroids of cells into close-by groups.
Walk through centroids of cells using a nearest neighbors tree such that the resulting walk order can be used to sort cells into close-by groups.
- Parameters
cents (pd.DataFrame) – Input centroids of cells. Should contain column “height” and “width”.
- Returns
result (pd.Series) – A series with same index as input cents whose values represent the order of nearest-neighbor walk.
-
minian.visualization.centroid(A, verbose=False)[source]¶ Compute centroids of spatial footprint of each cell.
- Parameters
A (xr.DataArray) – Input spatial footprints.
verbose (bool, optional) – Whether to print message and progress bar. By default False.
- Returns
cents_df (pd.DataFrame) – Centroid of spatial footprints for each cell. Has columns “unit_id”, “height”, “width” and any other additional metadata dimension.
-
minian.visualization.construct_G(g, T)[source]¶ Construct a convolving matrix from AR coefficients.
- Parameters
g (np.ndarray) – Input AR coefficients.
T (np.ndarray) – Number of time samples of the AR process.
- Returns
G (np.ndarray) – A T x T matrix that can be used to multiply with a timeseries to convolve the AR process.
See also
minian.cnmf.update_temporalfor more background on the role of AR process in the pipeline
-
minian.visualization.construct_pulse_response(g, length=500)[source]¶ Construct a model pulse response corresponding to certain AR coefficients.
- Parameters
g (np.ndarray) – The AR coefficients.
length (int, optional) – Number of timepoints in output. By default 500.
- Returns
s (np.ndarray) – Model spike with shape (length,), zero everywhere except the first timepoint.
c (np.ndarray) – Model convolved calcium response, with same shape as s.
See also
minian.cnmf.update_temporalfor more background on the role of AR process in the pipeline
-
minian.visualization.convolve_G(s, g)[source]¶ Convolve an AR process to input timeseries.
Despite the name, only AR coefficients are needed as input. The convolving matrix will be computed using
construct_G().- Parameters
s (np.ndarray) – The input timeseries, presumably representing spike signals.
g (np.ndarray) – The AR coefficients.
- Returns
c (np.ndarray) – Convolved timeseries, presumably representing calcium dynamics.
See also
minian.cnmf.update_temporalfor more background on the role of AR process in the pipeline
-
minian.visualization.datashade_ndcurve(ovly, kdim=None, spread=False)[source]¶ Apply datashading to an overlay of curves with legends.
- Parameters
ovly (hv.NdOverlay) – The input overlay of curves.
kdim (Union[str, List[str]], optional) – Key dimensions of the overlay. If None then the first key dimension of ovly will be used. By default None.
spread (bool, optional) – Whether to apply
holoviews.operation.datashader.dynspread()to the result. By default False.
- Returns
hvres (hv.Overlay) – Resulting overlay of datashaded curves and points (for legends).
-
minian.visualization.generate_videos(varr, Y, A=None, C=None, AC=None, nfm_norm=None, gain=1.5, vpath='.', vname='minian.mp4', options={'crf': '18', 'preset': 'ultrafast'})[source]¶ Generate a video visualizaing the result of minian pipeline.
The resulting video contains four parts: Top left is a original reference movie supplied as varr; Top right is the input to CNMF algorithm supplied as Y; Bottom right is a movie AC representing cellular activities as computed by
minian.cnmf.compute_AtC(); Bottom left is a residule movie computed as the difference between Y and AC. Since the CNMF algorithm contains various arbitrary scaling process, a normalizing scalar is computed with least square using a subset of frames from Y and AC such that their numerical values matches.- Parameters
varr (xr.DataArray) – Input reference movie data. Should have dimensions (“frame”, “height”, “width”), and should only be chunked along “frame” dimension.
Y (xr.DataArray) – Movie data representing input to CNMF algorithm. Should have dimensions (“frame”, “height”, “width”), and should only be chunked along “frame” dimension.
A (xr.DataArray, optional) – Spatial footprints of cells. Only used if AC is None. By default None.
C (xr.DataArray, optional) – Temporal activities of cells. Only used if AC is None. By default None.
AC (xr.DataArray, optional) – Spatial-temporal activities of cells. Should have dimensions (“frame”, “height”, “width”), and should only be chunked along “frame” dimension. If None then both A and C should be supplied and
minian.cnmf.compute_AtC()will be used to compute this variable. By default None.nfm_norm (int, optional) – Number of frames to randomly draw from Y and AC to compute the normalizing factor with least square. By default None.
gain (float, optional) – A gain factor multiplied to Y. Useful to make the results visually brighter. By default 1.5.
vpath (str, optional) – Desired folder containing the resulting video. By default “.”.
vname (str, optional) – Desired name of the video. By default “minian.mp4”.
options (dict, optional) – Output options for ffmpeg, passed directly to
write_video(). By default {“crf”: “18”, “preset”: “ultrafast”}.
- Returns
fname (str) – Absolute path of the resulting video.
-
minian.visualization.norm(a)[source]¶ Normalize an input array to range (0, 1) avoiding division-by-zero.
- Parameters
a (np.ndarray) – Input array.
- Returns
a_norm (np.ndarray) – Normalized array. If there is only one unique value in a then it is returned unchanged.
-
minian.visualization.normalize(a)[source]¶ Normalize an input array to range (0, 1) using
numpy.interp().- Parameters
a (np.ndarray) – Input array.
- Returns
a_norm (np.ndarray) – Normalized array.
-
minian.visualization.visualize_gmm_fit(values, gmm, bins)[source]¶ Visualization of the Gaussian mixture model fit.
This function visualize GMM fit by plotting the fitted gaussian curves on top of the histograms of values.
- Parameters
values (np.ndarray) – The raw values to which GMM is fitted.
gmm (sklearn.mixture.GaussianMixture) – The fitted GMM model object.
bins (int) – Number of bins when plotting the histogram.
- Returns
hvres (hv.Overlay) – The resulting visualization.
See also
-
minian.visualization.visualize_motion(motion)[source]¶ Visualize result of motion estimation.
This function plot motions across time. If the input has two dimensions, they are interpreted as rigid shifts along the “height” and “width” dimension of the movie, and plotted as curves across time. If the input has more than two dimensions, it is assumed that non-rigid motion estimation was enabled and each frame is split into several patches that will each have their own shifts. The separate shifts for patches within each frame are flattened into a column, then shifts along “height” and “width” dimensions are separately plotted as 2d images across time, whose columns represent frames and colors represent degree of shift.
- Parameters
motion (xr.DataArray) – Estimated motion.
- Returns
Union[hv.Layout, hv.NdOverlay] – If motion contains rigid shifts, then an overlay of two curves are returned. Otherwise two images representing non-rigid motions are returned.
-
minian.visualization.visualize_preprocess(fm, fn=None, include_org=True, **kwargs)[source]¶ Generalized visualization of preprocessing functions.
This function facilitates parameter exploration of preprocessing functions by plotting a single frame before and after the application of the function, along with a contour plot. All keyword arguments not listed below are passed directly to fn.
- Parameters
fm (xr.DataArray) – The input frame.
fn (Callable, optional) – The function to apply. If None then the original frame are visualized unchanged. By default None.
include_org (bool, optional) – Whether to include the original frame in the visualization. By default True.
- Returns
hvres (hv.HoloMap) – The resulting visualization containing images and contour plots.
See also
-
minian.visualization.visualize_seeds(max_proj, seeds, mask=None)[source]¶ Visualization of seeds.
This function plot seeds on top of a max projection. It can also visualize certain refining step of seeds by coloring the filtered-out seeds in red.
- Parameters
max_proj (xr.DataArray) – Max projection used as the background of the plot.
seeds (pd.DataFrame) – The seed dataframe.
mask (str, optional) – The name of the mask of seeds to visualize. If specified, then seeds must contain a boolean column with the same name. By default None.
- Returns
hvres (hv.Overlay) – The resuling overlay of seeds and max projection.
See also
-
minian.visualization.visualize_spatial_update(A_dict, C_dict, kdims=None, norm=True, datashading=True)[source]¶ Visualization of spatial update.
This function facilitates parameter exploration for spatial update by plotting the resulting spatial footprints and binarized spatial footprints from different runs of spatial update for a subset of cells, along with their corresponding temporal activities.
- Parameters
A_dict (dict) – A dictionary containing resulting spatial footprints from different runs of spatial update. Keys should be tuple containing the values of parameters that uniquely identify each run. Values should be spatial footprints of type xr.DataArray.
C_dict (dict) – A dictionary containing temporal activities of each cells in the same format as A_dict. The temporal activities of cells are not expected to change across different runs of spatial update, except the number of cells may be different due to dropping of cells in the update process.
kdims (Union[str, List[str]], optional) – Names of key dimensions identifying the parameter space. Should have same length as the keys in A_dict and C_dict. If None then a dimension names “dummy” will be created and the visualization can be used to visualize restults across cells. By default None.
norm (bool, optional) – Whether to normalize the temporal activities of each cell to range (0, 1) for visualization. By default True.
datashading (bool, optional) – Whether to apply datashading to temporal activities of cells. By default True.
- Returns
hvres (hv.HoloMap) – Resulting visualization.
See also
-
minian.visualization.visualize_temporal_update(YA_dict, C_dict, S_dict, g_dict, sig_dict, A_dict, kdims=None, norm=True, datashading=True)[source]¶ Visualization of temporal update.
This function facilitates parameter exploration for temporal update by plotting various temporal traces along with a model calcium response and the spatial footprint for each cell across different runs of temporal update. Four traces are plotted: “Raw Signal” correspond to the YrA variable, “Fitted Calcium Trace” correspond to C after update, “Fitted Spikes” correspond to S after update, and “Fitted Signal” correspond to C + b0 + c0 after update. See
minian.cnmf.update_temporal()for interpretation of each variable.- Parameters
YA_dict (dict) – A dictionary containing the YrA variables in the same format as C_dict. The YrA variable is not updated and is not expected to be different across different runs of temporal update.
C_dict (dict) – A dictionary containing resulting calcium traces (C_new) from different runs of temporal update. Keys should be tuple containing the values of parameters that uniquely identify each run. Values should be temporal traces of type xr.DataArray.
S_dict (dict) – A dictionary containing resulting deconvolved spike traces (S_new) from different runs of temporal update, in the same format as C_dict.
g_dict (dict) – A dictionary containing resulting AR coefficients (g) from different runs of temporal update, in the same format as C_dict.
sig_dict (dict) – A dictionary containing resulting fitted signals (C_new + b0_new + c0_new) from different runs of temporal update, in the same format as C_dict.
A_dict (dict) – A dictionary containing spatial footprint of cells in the same format as C_dict. The spatial footprints of cells are note expected to change across different runs of temporal update, except the number of cells may be different due to dropping of cells in the update process.
kdims (Union[str, List[str]], optional) – Names of key dimensions identifying the parameter space. Should have same length as the keys in C_dict etc. If None then a dimension names “dummy” will be created and the visualization can be used to visualize restults across cells. By default None.
norm (bool, optional) – Whether to normalize the temporal activities of each cell to range (0, 1) for visualization. By default True.
datashading (bool, optional) – Whether to apply datashading to temporal activities of cells. By default True.
- Returns
hvres (hv.HoloMap) – Resulting visualization.
See also
-
minian.visualization.write_video(arr, vname=None, vpath='.', norm=True, options={'crf': '18', 'preset': 'ultrafast'})[source]¶ Write a video from a movie array using python-ffmpeg.
- Parameters
arr (xr.DataArray) – Input movie array. Should have dimensions: (“frame”, “height”, “width”) and should only be chunked along the “frame” dimension.
vname (str, optional) – The name of output video. If None then a random one will be generated using
uuid4.uuid(). By default None.vpath (str, optional) – The path to the folder containing the video. By default “.”.
norm (bool, optional) – Whether to normalize the values of the input array such that they span the full pixel depth range (0, 255). By default True.
options (dict, optional) – Optional output arguments passed to ffmpeg. By default {“crf”: “18”, “preset”: “ultrafast”}.
- Returns
fname (str) – The absolute path to the video file.
See also